One Map for The Entire Transport Network
How a Kazakh platform tracks transport routes and models what happens when they change

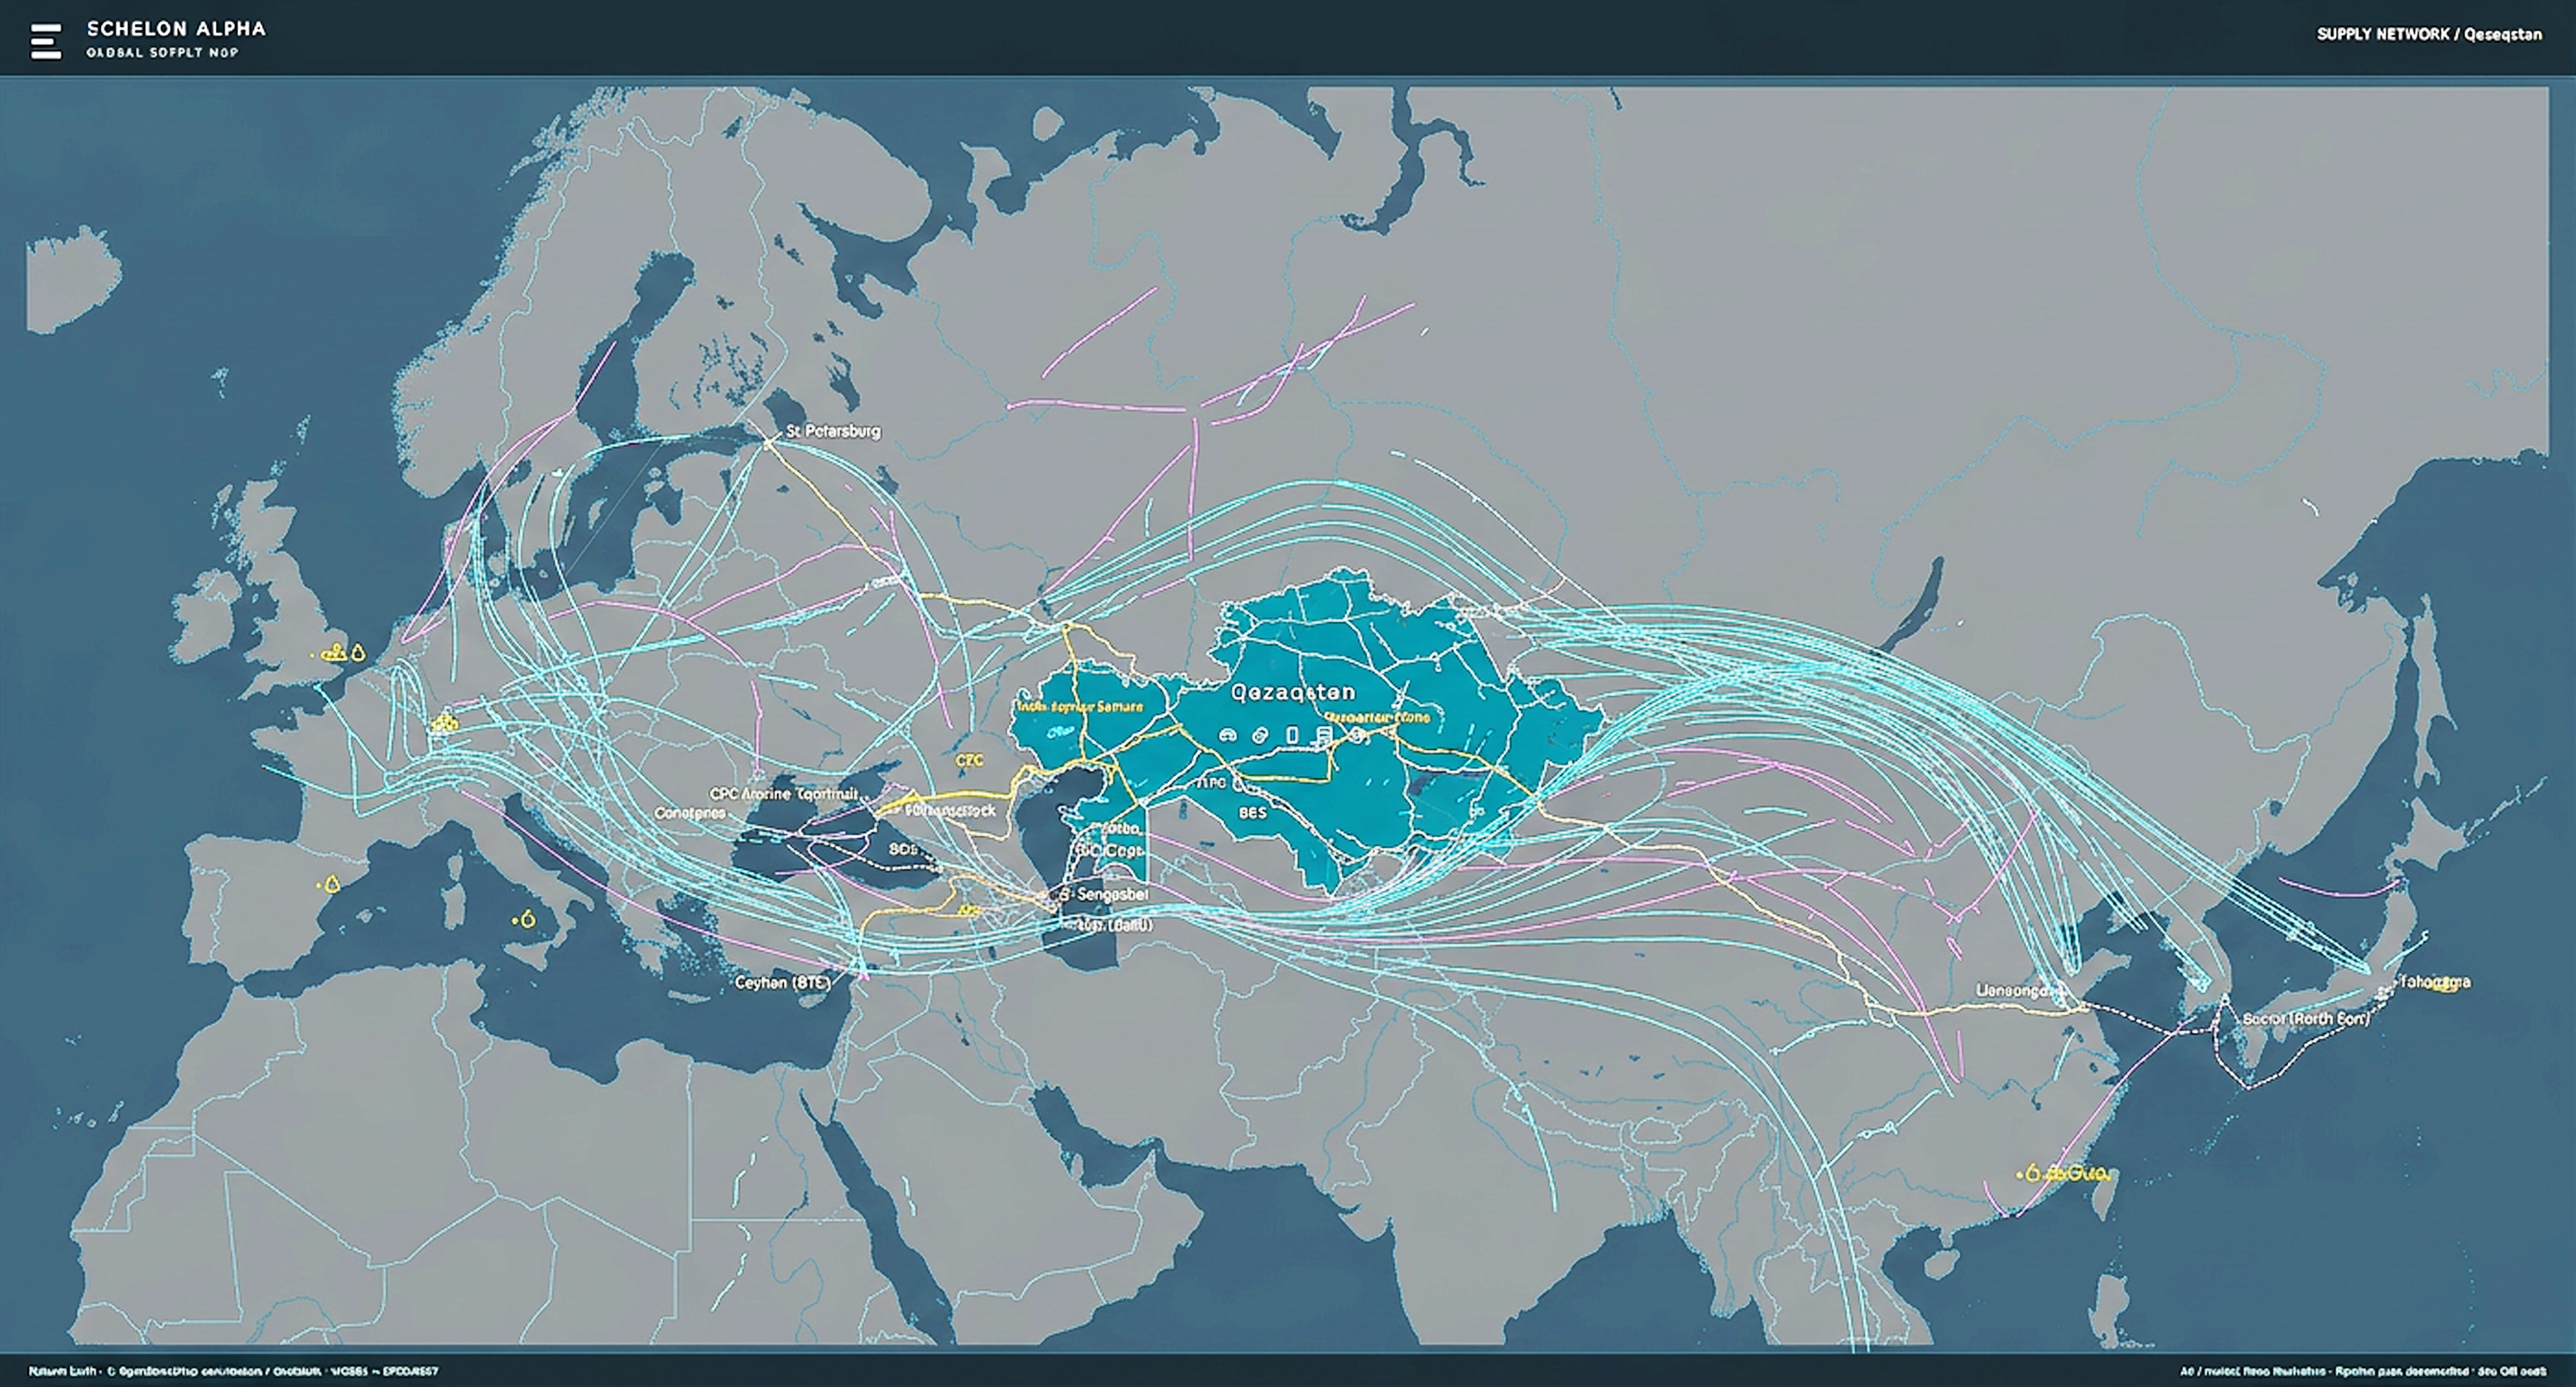
EchelonAlpha, a Kazakh platform that models air routes together with the country’s Ministry of Transport, combines air and rail routes, stations, airports and fuel infrastructure onto a single map, showing how a change in one link ripples across the entire network.
When an air corridor closes, a cargo flight from China to Europe still is not cancelled - it is rerouted. The new route changes fuel consumption, the refuelling airport and freight economics.
In Central Asia, such routing shifts have become routine. Airspace restrictions, sea lane disruptions and new trade regimes redirect cargo through the region, including along the Middle Corridor — the trans-Caspian route between China and Europe.
An airport that finds itself on the new routing path suddenly gains demand for jet fuel, terminal throughput and ground logistics. Whether it can meet the changes and retain that traffic no longer depends on a line on the map.
What does it depend on? On being able to see the new route, airport's capacity, fuel stocks, fuel supply routes and ground links to the city - all at once. However, this data is usually scattered: Aviation statistics are kept in one place, rail data in another, fuel information in a third. By the time everything is compiled to form a clear picture the situation may already have changed.
The entire routing network: one screen

EchelonAlpha, founded by entrepreneur Rakhman Assambayev, says it can help solve this dilemma. Its Echelon platform brings all the country's transport data together in a single, geographical dashboard where it can be monitored and analysed. In essence, it works as an AI-powered think tank: rather than simply storing data, it turns it into analysis, forecasts and recommendations for decision-makers. In August, Kazakhstan's Ministry of Transport announced that it was developing a system with the company to optimise route networks.
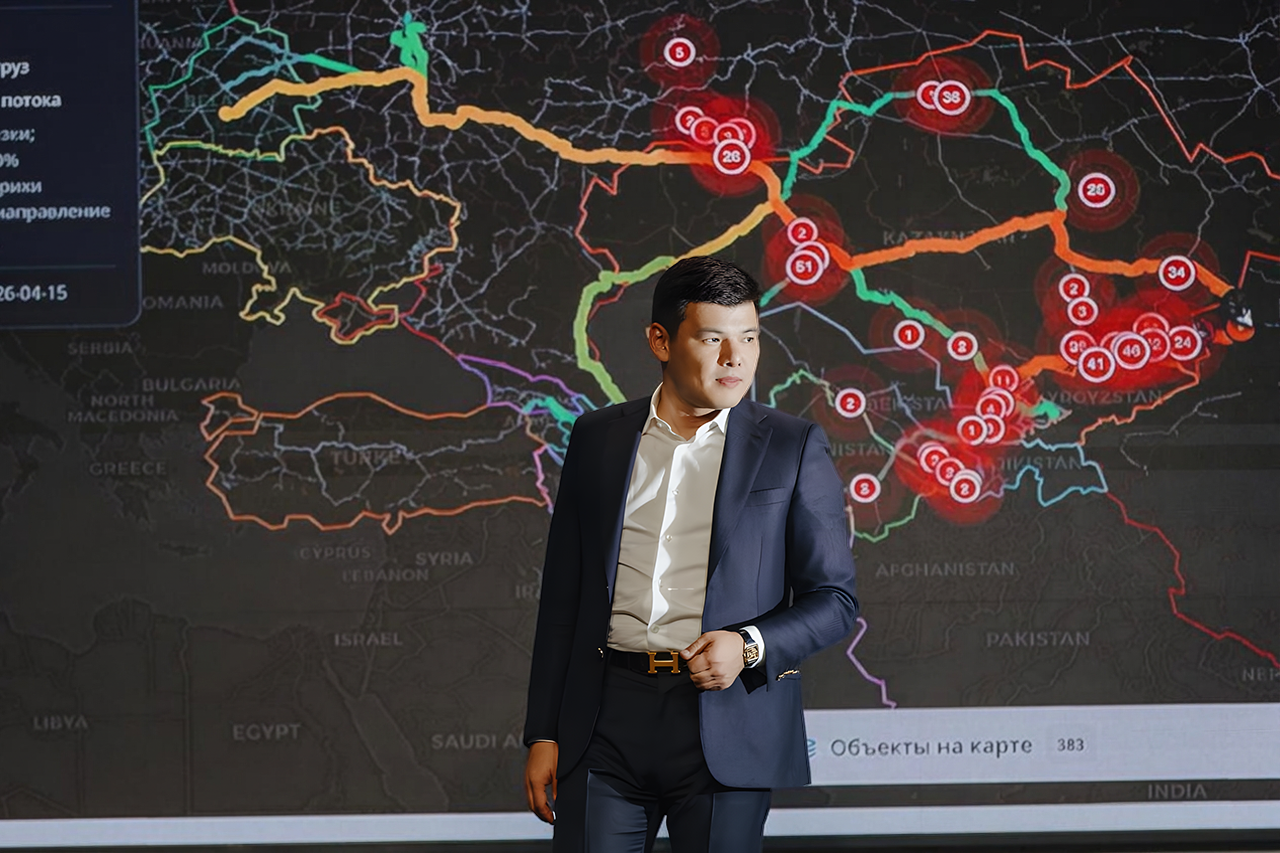
Echelon combines railways, stations, cities and domestic and international air routes on a single map, showcased at the AI & Digital Bridge 2026 international technology forum, earlier this October in Astana.
The Kazakh forum was opened by President Kassym-Jomart Tokayev, where he proposed “drawing up a list of industrial AI tasks grounded in the real needs of the economy” and described EchelonAlpha’s AI+X model as a way of applying artificial intelligence “in specific industries”. Echelon’s route network management platform does just that, serving specific clients with measurable outcomes from data already being collected..
From the developers perspective, the value lies not in the map itself, but in the ability to cross-reference its layers. An air service, a rail line near the airport and a bus route to the station all sit within the same coordinate system. Echelon clearly shows how regions are connected, showing where a city has air service but lacks a convenient ground connection, and where the opposite is true.
The platform also operates at the individual hubs level, tracking bus movements and arrivals times at stations. This data helps assess transport hub accessibility and model transfers between urban and intercity transit. The same ground-travel calculation makes it possible to assess the accessibility of territories, down to ambulance routes.
Another layer is the investment map, which adds logistics calculations and project efficiency assessments to the picture: A new terminal or rail line can be evaluated in terms of how it will fit into the existing network.
From Monitoring To Scenarios
Monitoring shows what is happening now, but the main argument for a unified model is the ability to answer the “what if” questions. In the company's forum demonstration, this is an airport closing for repairs: The platform shows where flights will be diverted, how traffic will be redistributed and what additional load neighbouring airports and ground transport will take on.
Similarly, Echelon assesses the connectivity of cities and regions. The system displays existing air services, making it possible to model new destinations within the context of an entire transport network, rather than as a single route in isolation.
Behind the map are three monitoring centres: the economy, transport and passenger connectivity, and oil and fuel. The output of one centre becomes the input for another. Rising demand for a product converts into transport volumes and fuel requirements, while a supply disruption feeds back into the economy through production costs, product availability and profitability.
According to Assambayev, the platform is built on open data, including statistics on trade, production, transport movements and infrastructure. The team links these data points mathematically to estimated values that no single source publishes directly.
The platform's AI component, Alpha, connects a user's question with the relevant computation models, while a language model helps frame the task and explain results. Specialised models calculate fuel burn, delivery times and the economics of each option, ensuring every figure can be traced back to its source data and formulas.
What Has Been Officially Confirmed
The most prominent aspect of the platform’s work is in aviation. The Ministry of Transport and the Aviation Administration of Kazakhstan have announced a system that analyses destination demand, forecasts transit potential and models a future route network.
According to the founder, the team calculates passenger flows, proposes new route options and assesses their economic viability in light of changing airspace availability.

270 Factors Per Flight
Assambayev confirmed that the aviation model is already operational, in most detail for cargo. Each flight is evaluated by around 270 factors, including weather, flight levels and headwinds – all of which determine fuel burn.
The calculation continues on the ground to factor turnaround time, delays, technical stops for refuelling, unloading and handling cargo. As the company notes, even with the same jet fuel prices, a flight’s bottom line can fluctuate depending on how much time the aircraft spends on the ground.
This is where data cross-referencing is most visible and critical. The model checks the fuel supply chain, identifying which refinery can supply the required volume of jet fuel, whether to deliver it to the airport by rail or road, and assessing whether local storage capacity is sufficient. Finally, the platform assesses the airport’s ability to receive and handle a specific aircraft type. This way, an air route is thus tested against rail logistics, refining and airport infrastructure all at once.
For regional airports, forced transits can quickly fill up a hub, begging the question: Will carriers stay once airspace restrictions are lifted?
The Echelon developers describe this change in regional airport traffic patterns as a shift from “synthetic” flows, created by external restrictions, to organic ones - those sustained by demand, price, speed and delivery reliability.
When A Route Changes The Costs
The company applies the same approach to the oil and gas industry. According to the founder, the Echelon model incorporates around 4,800 factors influencing the industry’s supply chain. Using approximately 117 interconnected calculation modules, it analyses how activities across the industry – from production and refining to exports and domestic supply - affect the revenues of companies and other shareholders, as well as the tax revenues collected by the state.
Here, too, the route is critical. Freight, demurrage, straits delays and transshipment determine how much each stakeholder in the chain ultimately gets paid. Assambayev highlights a case where supply volumes barely changed, yet profitability was redistributed: higher freight rates and longer waiting times cut into producer returns, changing tax calculations. These changes were modelled in advance by Echelon and later validated by actual results.

The Middle Corridor: Where The Next Bottleneck Will Appear
Transit stakes are high. In 2023, the World Bank estimated that by 2030, combined investment and efficiency measures could triple cargo volumes and halve travel times on the Middle Corridor. Of course, this is an estimate of potential if certain conditions are met, not a forecast.
The developers believe this exact model mapping of the entire network is essential. Expanding a port or terminal only makes sense if there’s a need: production and markets that will keep it busy, and ground routes that will deliver cargo through it.
The model is designed to highlight which bottlenecks will disappear after an investment, but also pinpoint where the next one will emerge, whether it’s a border delay, fuel shortage or lack of backhaul cargo.
What Comes Next?
Food security and regional energy are the next areas EchelonAlpha is developing models for. For food security, the task is to distinguish actual product shortage from supply chain challenge or drops in consumer purchasing power. In energy, the goal is to determine whether a specific regional grid can support a new plant during peak hours.
Large-scale digital modelling platforms are being developed globally: Singapore is building a national virtual replica for urban planning and resource management, while Siemens and NVIDIA expanded their industrial AI partnership in January 2026. As a research objective, EchelonAlpha aims to link engineering processes with an entire country’s economy, becoming able to project forecasts 20-50 years ahead.
Powerful Forecasts, But Proof Is Still Pending
Most information about the platform's capabilities comes from the company itself. While the AI & Digital Bridge 2026 forum demonstration illustrated Echelon’s interface and system, it did not verify the accuracy of its calculations. As of yet, there is no independent assessment of the models or their commercial impact.
This remains a key concern for the Kazakh government. Speaking at the forum, President Tokayev noted that only “the best projects that have proven their effectiveness” would move into production.
The developers acknowledge the limitations of their approach. Because the decisions of market participants shift in response to prices, the system models their behaviour using assumptions and several possible responses.
Data update frequency also matters for monitoring. Aircraft positions are updated almost continuously, whereas trade statistics are released monthly, meaning different map layers reflect different points in time. If an unknown parameter could alter a conclusion, the team flags the result as conditional.
Ultimately, transparency will be the main test. This requires tracking the date of the forecast dates, available data available, comparison baselines and actual outcome.
For Kazakhstan, the goals is converting its experience as a transit economy into an exportable technology.
But for regional governments and companies, the main question is a practical one: which route to develop, hub to strengthen, and how the entire network will behave when conditions change yet again.
